This may be of interest to you?
First the disclaimer - My Camper is not a lab, I do not check for a "control" to ensure only one thing varies, so while the information I believe is useful and interesting to those so inclined to read and review it, it should be taken for what it is - a snapshot of a single campervan at specific times.
So what an I going to show?
I decided to defrost the fridge after being away at the weekend as the icebox at the top was getting a bit 'furry'. I then later thought this would give me an idea to compare power with fridge on and fridge off with the stats I gather

- At all times the Victron 12/500 Inverter was left on, and in "On" mode (rather than "Eco")
- I chose the time range to monitor the power usde to be from 10PM to 5AM as that eliminates external factors such as solar power input, courtesy lights coming on if I enter van (these are wired to leisure battery on my camper), etc.
Note that the Power, Current and Voltage ranges vary slightly between the two days as they are auto-generated (I am using screenshots of Victron VRM charts, not my own generated Excel ones here), so to compare the days for absolute values, please read across to see the values.
Night of July 18/19
The Fridge is running after being defrosted. It has drinks in the door pocket but apart from that is mostly empty.
FridgeON - PIV by
David, on Flickr
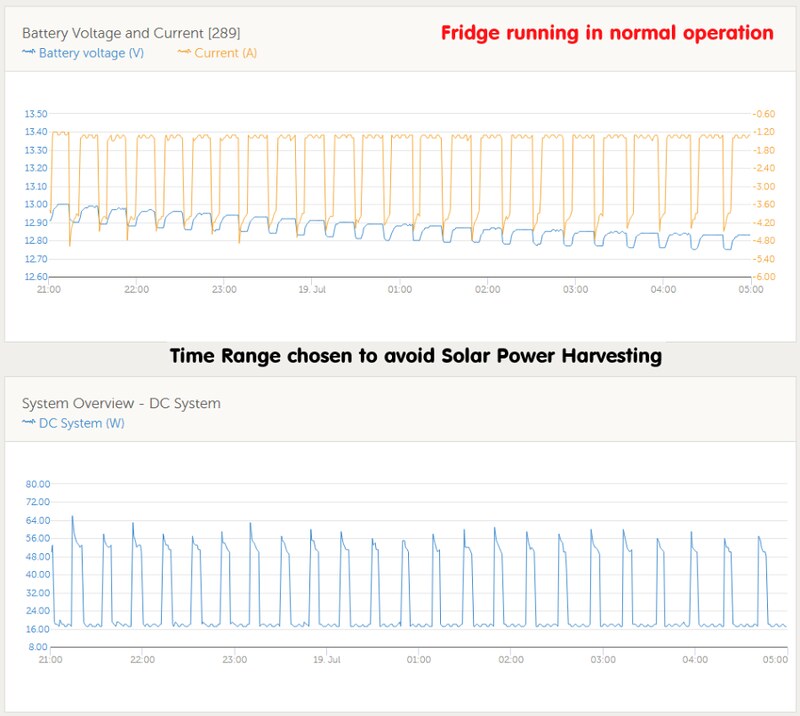
You see this kind of sawtooth pattern here - each 'tooth' is the fridge coming on for a set time.
When the fridge is on, total power draw is around 52W; When the fridge is off, the total power draw is 18W.
This 18W constant use will be: Inverter O/H, Raspberry Pi computer, Network Router & Wi-Fi Radio Booster, and finally the roof fan (left set to Auto so I cannot be sure if it is actively running or not).
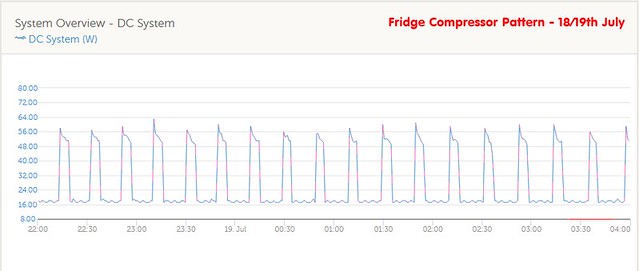
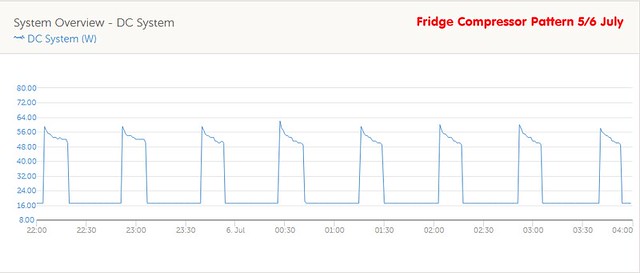
There seems to be two different patterns of Fridge activity which I will guess is a factor of the amount of cooling required. The chart above shows short - 5 minute - bursts of Compressor on-time, but quite frequent. The other (more common pattern looking at historical data) is the Compressor being on less frequently but for a longer time (around 15 mins).
This shows what I am referring to:
Fridge Power Use Pattern last Night
CompPattern-18-19 by
David, on Flickr
Fridge Power Use Pattern - same time period a couple of weeks ago
CompPattern-5-6 by
David, on Flickr
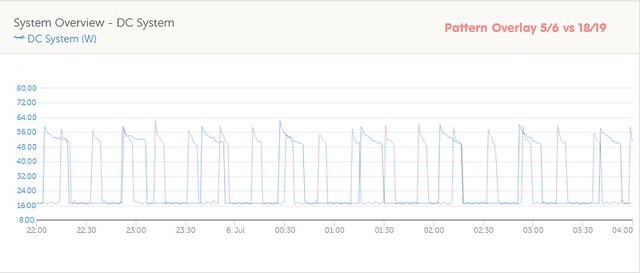
As can be seen, the power draw when on and when off is identical, and the only difference is the on-duration and its frequency (here is a chart with the two graphs overlaid)
CompPattern-Overlay by
David, on Flickr
I suspect the short bursts happen when the fridge is needing more cooling - At the time of the first chart, it was still in the process of bring down the internal temp from the Ambient (defrosted with door open)
As far as numbers go, with the short bursts, it uses 4Wh each time it kicks on (I have added 0.6Wh for the big on-rush that happens each time but lasts just a few seconds).
And the longer but less frequent runs it uses 10Wh each time.
To extrpolate the data for a full day, multiply the number of on-times by the power to get a ballpark figure (remembering not to use the longer on-time duration power use with the more frequent events of course!)
Night of July 16/17
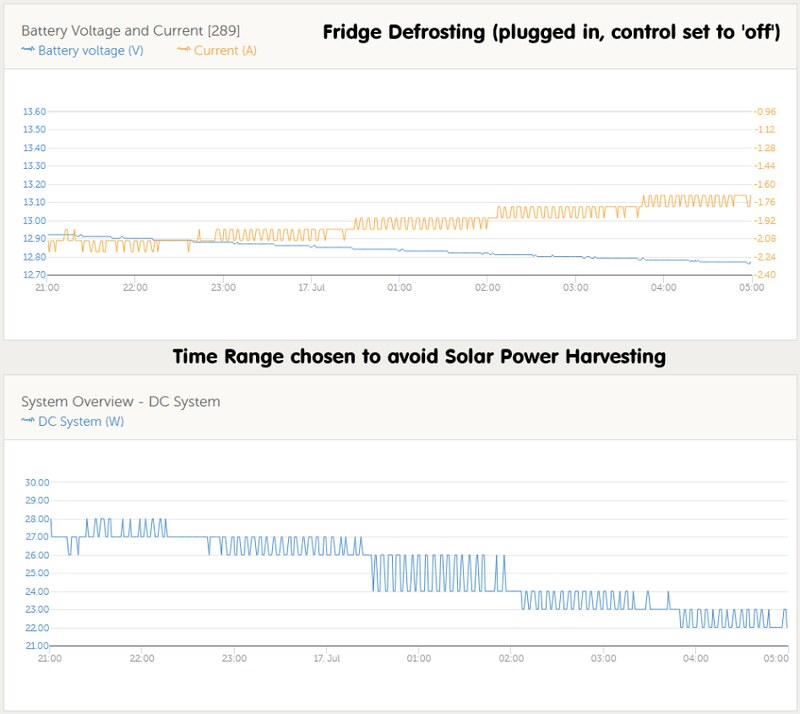
The Fridge was turned off and door left open, but was NOT unplugged (this is relevant!)
FridgeDEFROST - PIV by
David, on Flickr
An interesting pattern here - I don't know for sure but I think this is down to the data graphing granularity being limited plus maybe the roof fan motor (I really don't know!). Bear in mind here that each line mark is just a single Watt difference so step changes can appear exaggerated.
The difference here is that the minimum power draw has gone up to 22W from 18W, and starts off a little higher at 27W. I am going to guess that the step-down drop every couple of hours is the Roof Fan slowing down slightly as the ambient temp drops (as mentioned it is automatic and varies the speed depending on difference between ambient temp and target temp set)
Why is the minimum higher now than when the fridge was running? actually very simple to answer that ... The fridge door was open which meant the light was on! that is (I think) a nominal 6W bulb.
If I knew I would be doing some comparisions like this, I would have actually unplugged the fridge (maybe next time I will do so?)
Anyways, that is the minute by minute graphing of the two nights - what is the conclusion?
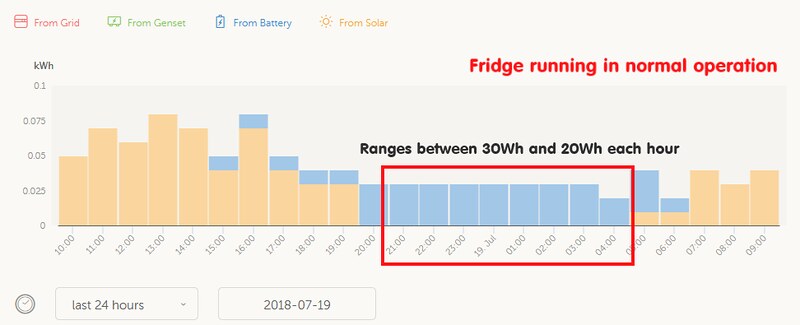
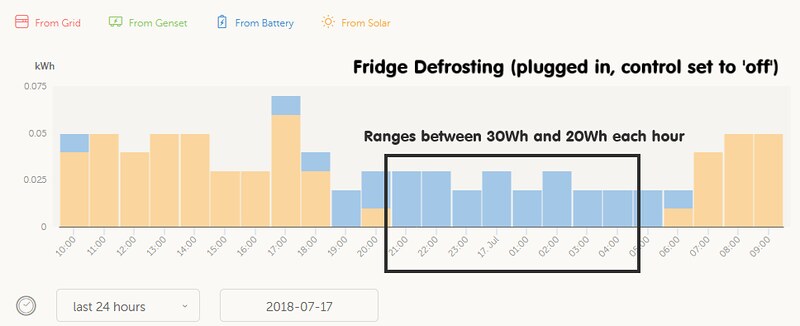
Here we are with the same times blocked (I actually included between 21:00 and 22:00 so ignore first hour in blocked section)
Fridge ON
FridgeON - Consumption by
David, on Flickr
Fridge OFF
FridgeDEFROST - Consumption by
David, on Flickr
So the Fridge being ON meant over the 7 hours examined, the Fridge drew approx 30Wh more power on the graphs.
Add on the Fridge Light use that shouldn't really have been in the OFF chart (so 6W x 7 Hours) and you will get a total of 72Wh over a 7 Hour Period specific to the Fridge being on.
Extrapolate again for a 24 Hour period, and we will get 245Wh in a day (the official specs quote 84kWh/Annum which is 230Wh/Day)
If you want to add in an Inverter overhead, that might be relevant if the Inverter serves just the Fridge (in my Camper, the Inverter has other uses 24/7 so I leave it on regardless of Fridge. The overhead of the Victron is mean to be something like 4W IIRC)
What I can say is that despite the very high temps we have had in the UK recently, the Fridge has worked without a hiccup and food and drink has been kept cold and it has had to work at the same temperature extremes that a Weaco 12V Compressor would (i.e. above the Weaco/Dometic official upper operating limit).
The power usage
once at the set temp oddly seems to vary very little no matter whatever the ambient temp is (which will be due to the insulation I guess?). I would have expected it to go up (but at the same time, the solar would harvest more and more than compensate so wouldn't matter)
This may or may not have answered some questions, but that is probably it from me in terms of providing power usage for the fridge installation.


